Excel modelling · Automation · Operational intelligence

Excel Project Portfolio

A curated selection of advanced Excel projects showcasing forecasting, automation, operational modelling and compliance analytics.

Financial Forecasting & Scenario Model

Rolling 12‑month forecasting · Scenario analysis
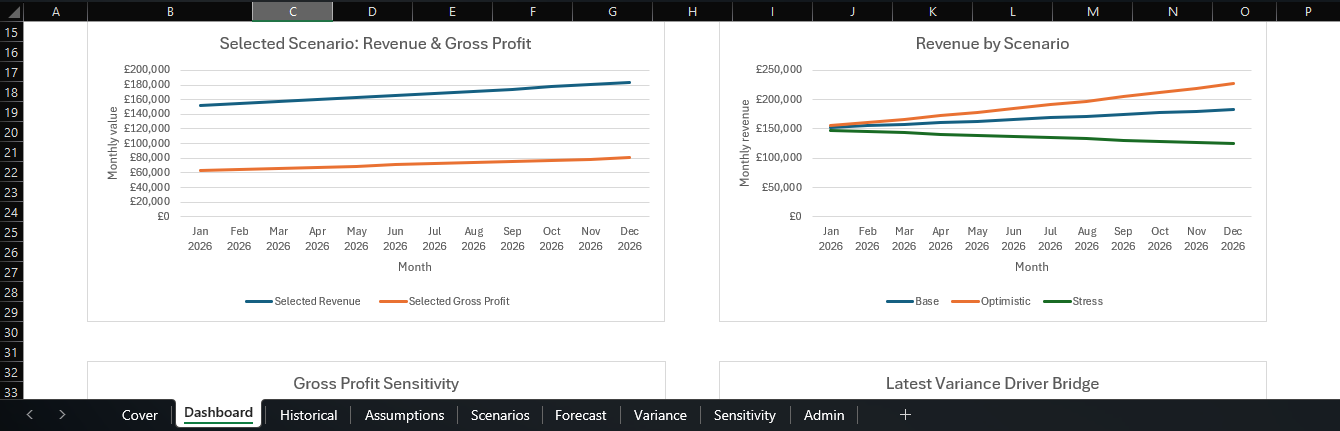
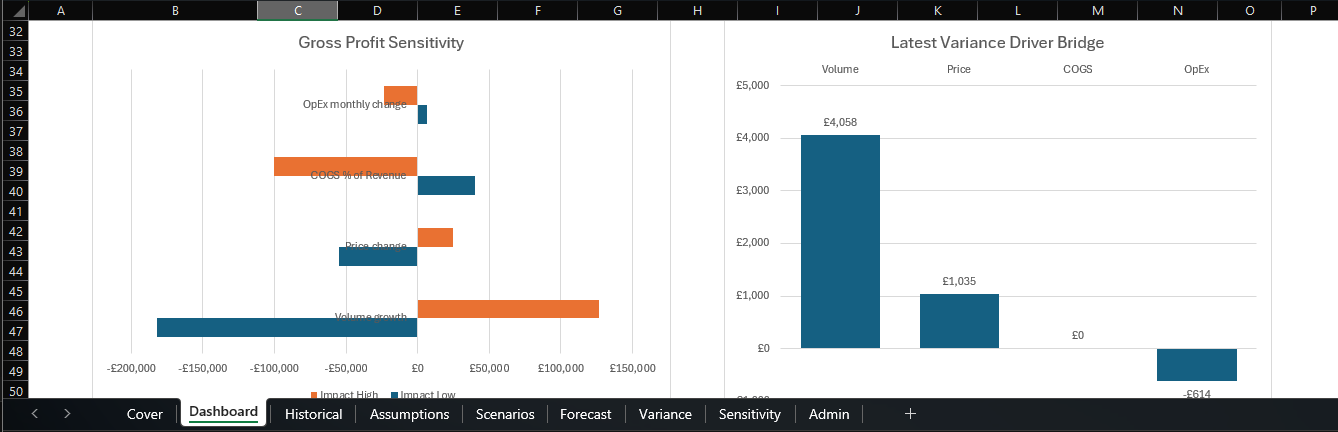
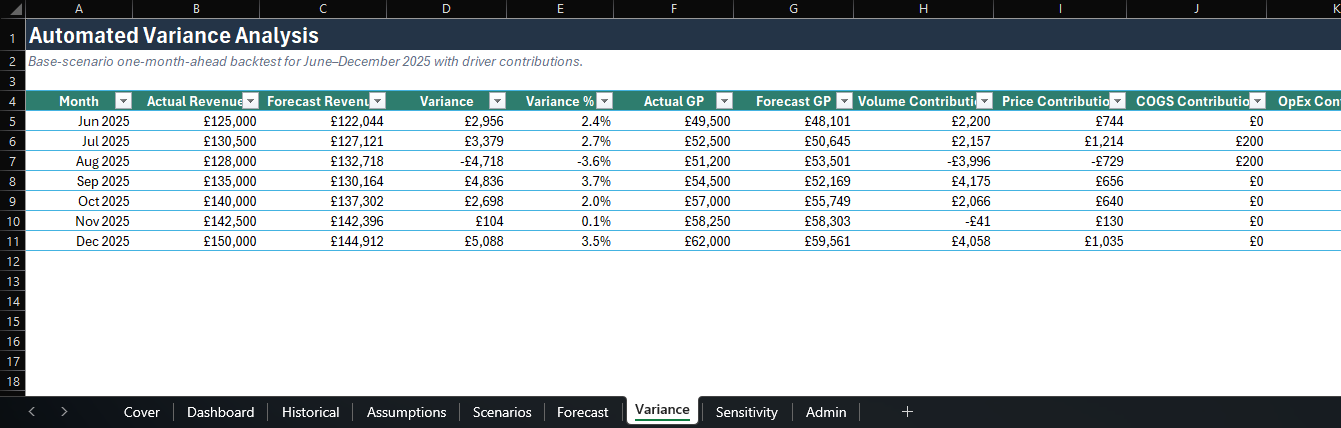
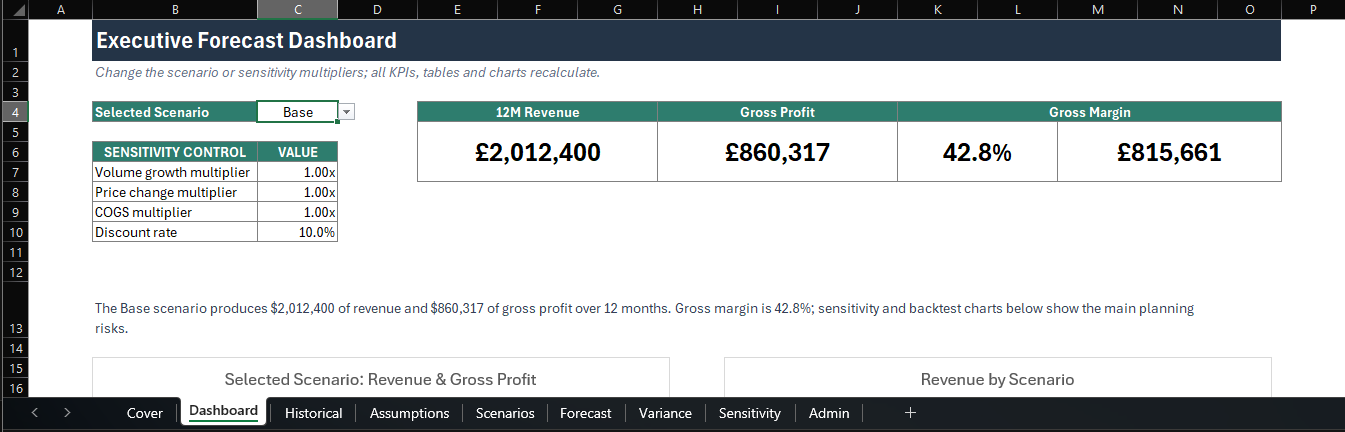
Forecast Dashboard Part 1 Forecast Dashboard Part 2 Forecast Dashboard Part 3 Variance Automation

A fully automated 12‑month rolling forecasting engine with Base, Optimistic and Stress scenarios. Designed for leadership planning, sensitivity testing and operational decision‑making.

The model integrates historical actuals, editable assumptions, dynamic scenario selection and sensitivity multipliers. All charts and KPIs update instantly based on user inputs.

Description

The forecasting engine uses structured inputs for revenue, volume, price, COGS and OpEx. Scenario drivers are stored as true decimals, enabling precise compounding calculations. A sensitivity module applies low/high shocks to key drivers and quantifies their impact on gross profit.

A variance module backtests forecast accuracy against actuals, decomposing variance into volume, price, COGS and OpEx contributions.
Features & Techniques Used

  • Dynamic named ranges and structured tables
  • Scenario driver matrix and lookup keys
  • Rolling 12‑month forecast logic
  • Variance decomposition engine
  • Sensitivity shock modelling
  • Advanced Excel formulas (INDEX/XMATCH, OFFSET, SUMPRODUCT)
Download Excel File

Operational Query Management Tracker

Workload modelling · SLA compliance · Agent capacity
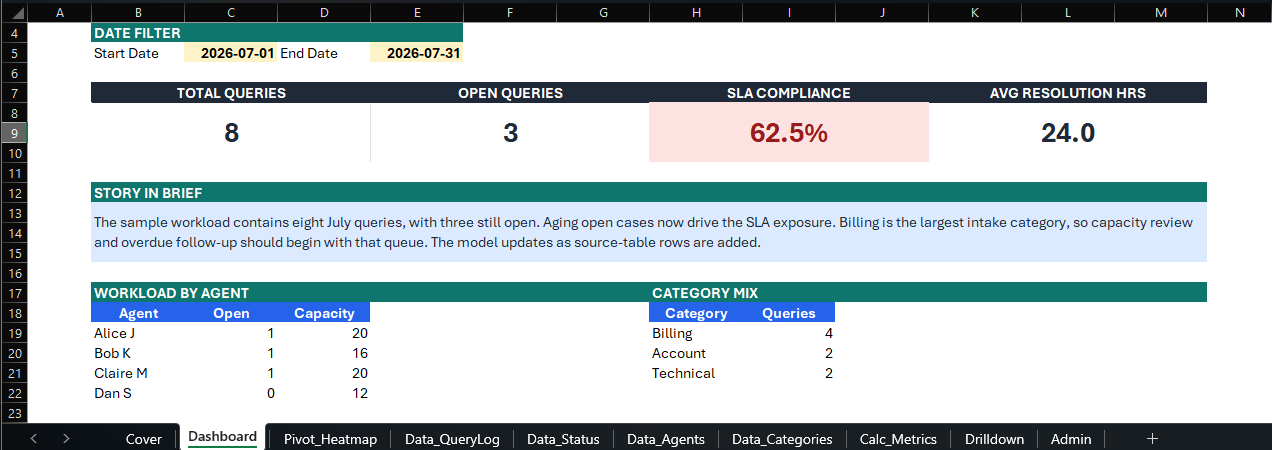
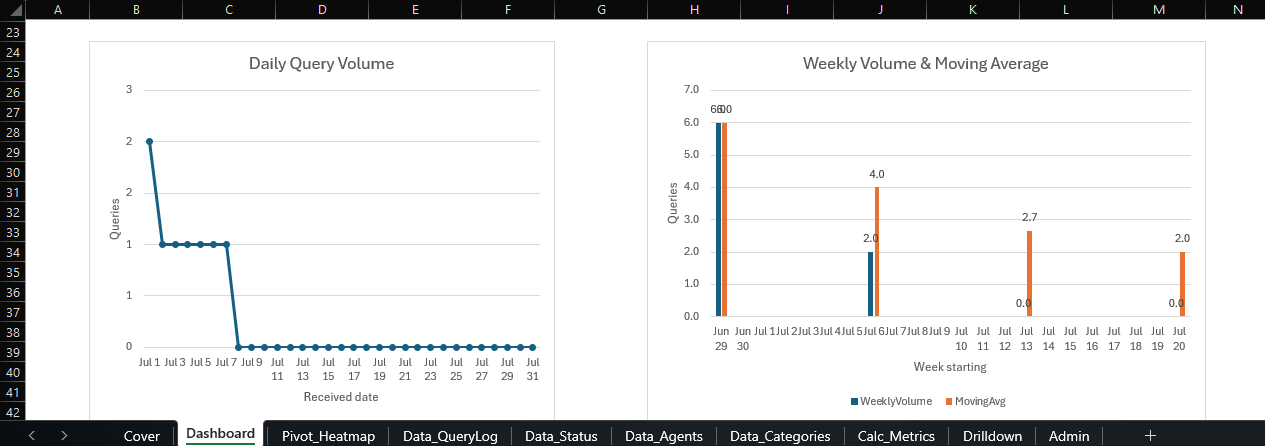
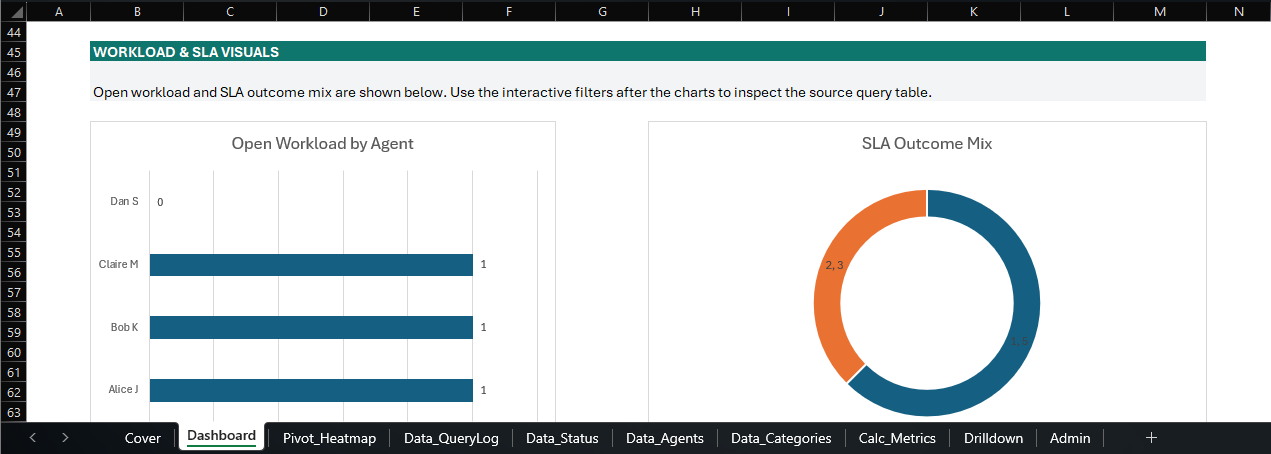
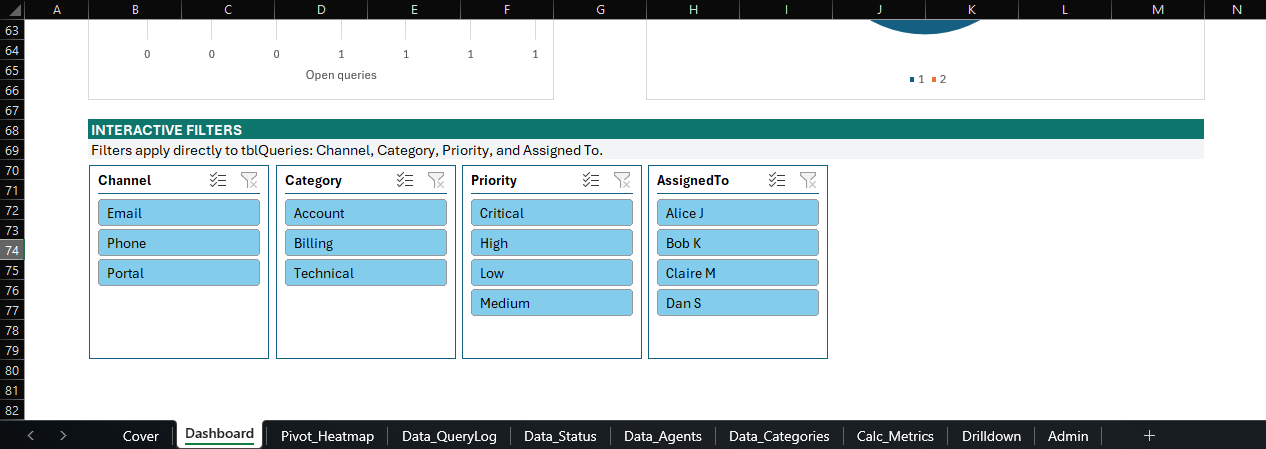
Operations Dashboard Part 1 Operations Dashboard Part 2 Operations Dashboard Part 3 Operations Dashboard Part 4

A structured operational model for managing client queries, SLA exposure, agent workload and category‑level trends. Designed for high‑volume environments requiring transparency and control.

Description

The dashboard provides executive KPIs, workload distribution, SLA compliance and ageing analysis. Interactive filters allow real‑time inspection of the underlying query log.

A heat map highlights workload concentration across agents and categories, supporting capacity planning and escalation decisions.

Features & Techniques Used

  • Structured tables for queries, status, agents and categories
  • Dynamic SLA calculations and breach flags
  • PivotTable heat maps
  • Daily and weekly metric engine
  • Interactive dashboard filters
  • Advanced formulas (XLOOKUP, SUMIFS, FILTER)
Download Excel File

Regulatory Data Insights Dashboard

Compliance analytics · Breach monitoring · Risk scoring
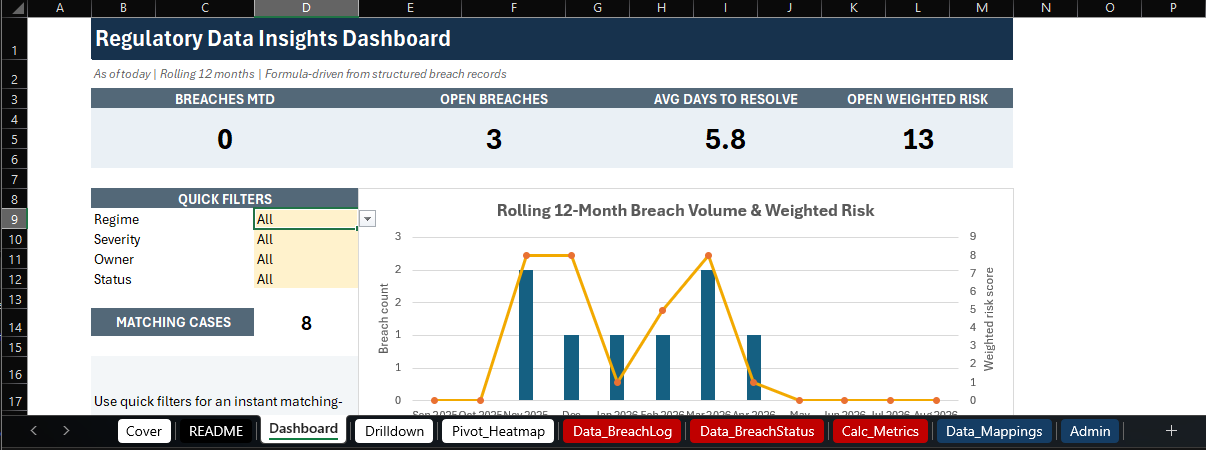
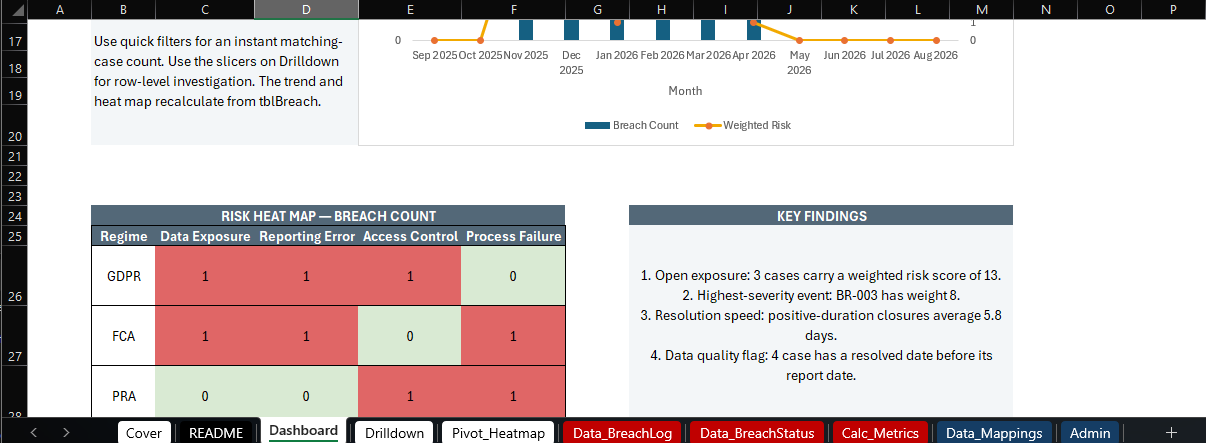
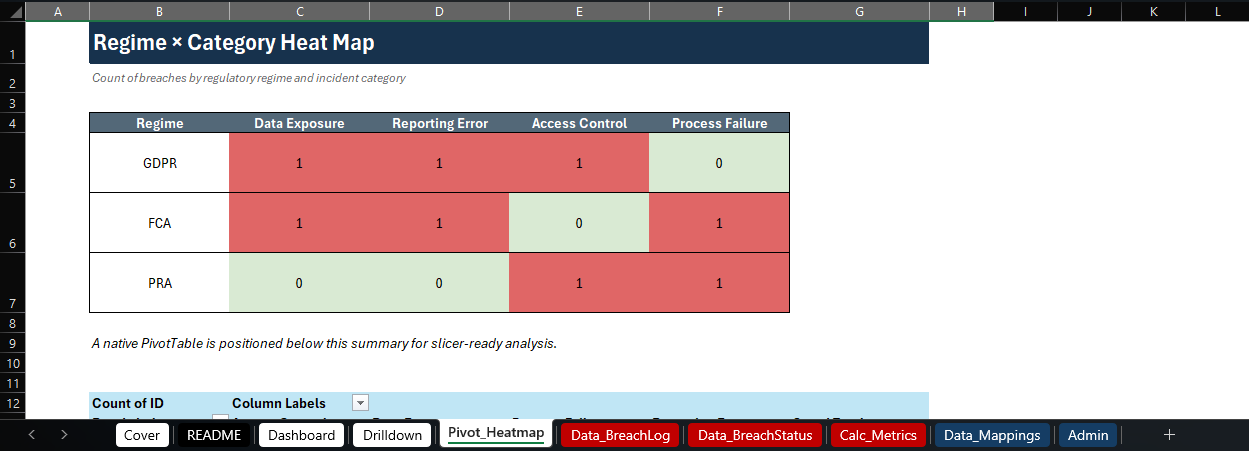
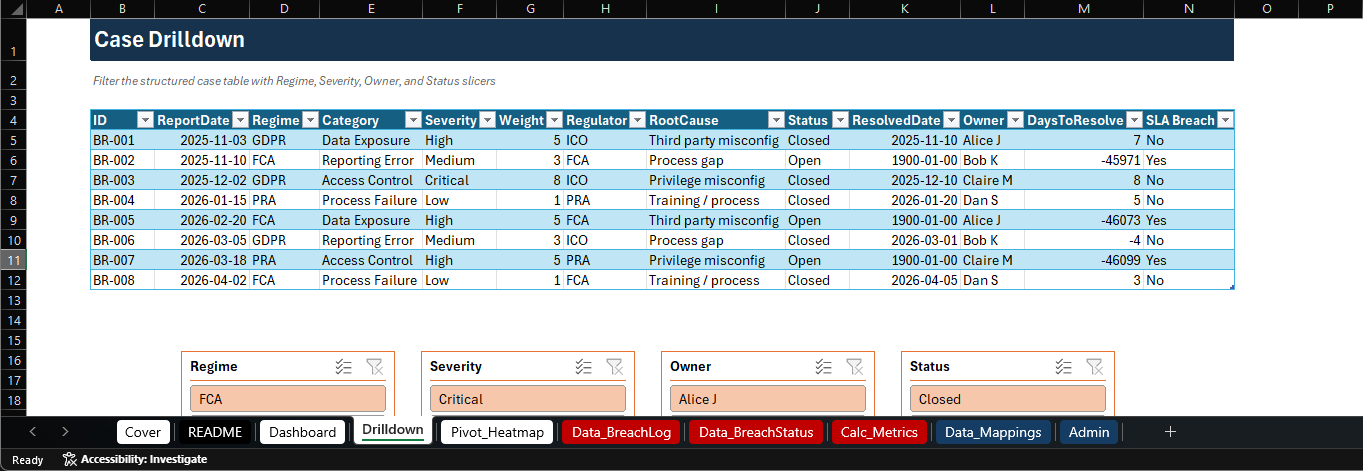
Dashboard Part 1 Dashboard Part 2 Regime × Category Heat Map Regulatory Drilldown

A compliance‑focused dashboard for monitoring regulatory breaches, analysing risk trends and supporting case‑level investigation.

Description

The model tracks breach records, mapped severity, regulator and root‑cause fields. A rolling 12‑month metric engine calculates weighted risk and open‑case trends.

Drilldown slicers allow targeted investigation by regime, severity, owner or status.

Features & Techniques Used

  • Structured breach log and status register
  • Severity weighting and risk scoring
  • Rolling 12‑month trend calculations
  • PivotTable heat maps
  • Interactive slicers for investigation
  • Advanced formulas (XLOOKUP, SUMIFS, dynamic arrays)
Download Excel File